- You are here:
- Home
- Data Science Course with Python Certification

Data Science Course with Python Certification
Develop your data visualization skills using advanced libraries like Pandas, Matplotlib, and Scikit.
Python is a rapidly growing high-level programming language that enables clear programs on small and large scales. Its advantage over other programming languages such as R is in its smooth learning curve, easy readability, and easy-to-understand syntax. With the right training Python can be mastered quick enough and in this age where there is a need to extract relevant information from tons of Big Data, learning to use Python for data extraction is a great career choice.Our course will introduce you to all the fundamentals of Python and upon course completion, you will know how to use it competently for data research and analysis. Payscale.com puts the median salary for a data scientist with Python skills at close to $100,000; a figure that is sure to grow in leaps and bounds in the next few years as demand for Python experts continues to rise.
Highlights
Testimonials
- Get advanced knowledge of data science and how to use them in real-life business.
- Understand the statistics and probability of Data science.
- Get an understanding of data collection, data mining, and machine learning.
- Learn tools like Python.
- By the end of this course, you would have gained knowledge on the use of data science techniques and the Python language to build applications on data statistics. This will help you land jobs as a data analyst.
Key Features
Details
- What is Data Science?
- Analytics Landscape
- Life Cycle of a Data Science Project
- Data Science Tools & Technologies
- Python Basics
- Data Structures in Python
- Control & Loop Statements in Python
- Functions & Classes in Python
- Working with Data
- Analyze Data using Pandas
- Visualize Data
- Case Study
- Know how to install Python distribution like Anaconda and other libraries.
- Write python code for defining your own functions, and also learn to write object oriented way of writing classes and objects.
- Write python code to import dataset into python notebook.
- Write Python code to implement Data Manipulation, Preparation & Exploratory Data Analysis in a dataset.
- Measures of Central Tendency
- Measures of Dispersion
- Descriptive Statistics
- Probability Basics
- Marginal Probability
- Bayes Theorem
- Probability Distributions
- Hypothesis Testing
- ANOVA
- Linear Regression (OLS)
- Case Study: Linear Regression
- Principal Component Analysis
- Factor Analysis
- Case Study: PCA/FA
- With attributes describing various aspect of residential homes, you are required to build a regression model to predict the property prices.
- Reduce Data Dimensionality for a House Attribute Dataset for more insights & better modeling.
- Logistic Regression
- Case Study: Logistic Regression
- K-Nearest Neighbor Algorithm
- Case Study: K-Nearest Neighbor Algorithm
- Decision Tree
- Case Study: Decision Tree
- With various customer attributes describing customer characteristics, build a classification model to predict which customer is likely to default a credit card payment next month. This can help the bank be proactive in collecting dues.
- Predict if a patient is likely to get any chronic kidney disease depending on the health metrics.
- Wine comes in various types. With the ingredient composition known, we can build a model to predict the Wine Quality using Decision Tree (Regression Trees).
- Understand Time Series Data
- Visualizing Time Series Components
- Exponential Smoothing
- Holt's Model
- Holt-Winter's Model
- ARIMA
- Case Study: Time Series Modeling on Stock Price
- Write python code to Understand Time Series Data and its components like Level Data, Trend Data and Seasonal Data.
- Write python code to Use Holt's model when your data has Constant Data, Trend Data and Seasonal Data. How to select the right smoothing constants.
- Write Python code to Use Auto Regressive Integrated Moving Average Model for building Time Series Model.
- Dataset including features such as symbol, date, close, adj_close, volume of a stock. This data will exhibit characteristics of a time series data. We will use ARIMA to predict the stock prices.
- Industry relevant capstone project under experienced industry-expert mentor
Module 1: Intro to Data Science
Learning Objectives:Get an idea of what data science really is. Get acquainted with various analysis and visualization tools used in data science.
Topics Covered:
Module 2: Mastering Python
Learning Objectives:In this module you will learn how to install Python distribution - Anaconda, basic data types, strings & regular expressions, data structures and loops and control statements that are used in Python. You will write user-defined functions in Python and learn about Lambda function and the object oriented way of writing classes & objects. Also learn how to import datasets into Python, how to write output into files from Python, manipulate & analyze data using Pandas library and generate insights from your data. You will learn to use various magnificent libraries in Python like Matplotlib, Seabo & ggplot for data visualization and also have a hands-on session on a real-life case study.
Topics Covered:
Hands-on:
Module 3: Probability and Statistics
Learning Objectives:Visit basics like mean (expected value), median and mode. Understand distribution of data in terms of variance, standard deviation and interquartile range and the basic summaries about data and measures. Learn about simple graphics analysis, the basics of probability with daily life examples along with marginal probability and its importance with respective to data science. Also learn Baye's theorem and conditional probability and the alternate and null hypothesis, Type1 error, Type2 error, power of the test, p-value.
Topics Covered:
Hands-on: Write python code to formulate Hypothesis and perform Hypothesis Testing on a real production plant scenario.
Module 4: Advanced Statistics & Predictive Modeling - I
Learning Objectives:In this module you will learn analysis of Variance and its practical use, Linear Regression with Ordinary Least Square Estimate to predict a continuous variable along with model building, evaluating model parameters, and measuring performance metrics on Test and Validation set. Further it covers enhancing model performance by means of various steps like feature engineering & regularization.
You will be introduced to a real Life Case Study with Linear Regression. You will learn the Dimensionality Reduction Technique with Principal Component Analysis and Factor Analysis. It also covers techniques to find the optimum number of components/factors using screen plot, one-eigenvalue criterion and a real-Life case study with PCA & FA.
Topics Covered:
Hands-on:
Module 5: Advanced Statistics & Predictive Modeling - II
Learning Objectives:Learn Binomial Logistic Regression for Binomial Classification Problems. Covers evaluation of model parameters, model performance using various metrics like sensitivity, specificity, precision, recall, ROC Cuve, AUC, KS-Statistics, Kappa Value. Understand Binomial Logistic Regression with a real life case Study.
Learn about KNN Algorithm for Classification Problem and techniques that are used to find the optimum value for K. Understand KNN through a real life case study. Understand Decision Trees - for both regression & classification problem. Understand Entropy, Information Gain, Standard Deviation reduction, Gini Index, and CHAID. Use a real Life Case Study to understand Decision Tree.
Topics Covered:
Hands-on:
Module 6: Time Series Forecasting
Learning Objectives:Understand Time Series Data and its components like Level Data, Trend Data and Seasonal Data. Work on a real- life Case Study with ARIMA.
Topics Covered:
Hands-on:
Module 7: Capstone Project
Learning Objectives:A mentor guided, real-life group project. You will go about it the same way you would execute a data science project in any business problem.
Topics Covered:
Hands-on: Project to be selected by candidates.
- There are no prerequisites to attend this course.
- Elementary programming knowledge will be useful.
Prerequisites
- Those interested in data science who want to learn essential data science skills.
- Those looking for a more robust, structured data science learning program.
- Data Analysts, Economists, or Researchers working with large datasets.
- Software or Data Engineers are interested in learning the basics of quantitative analysis.
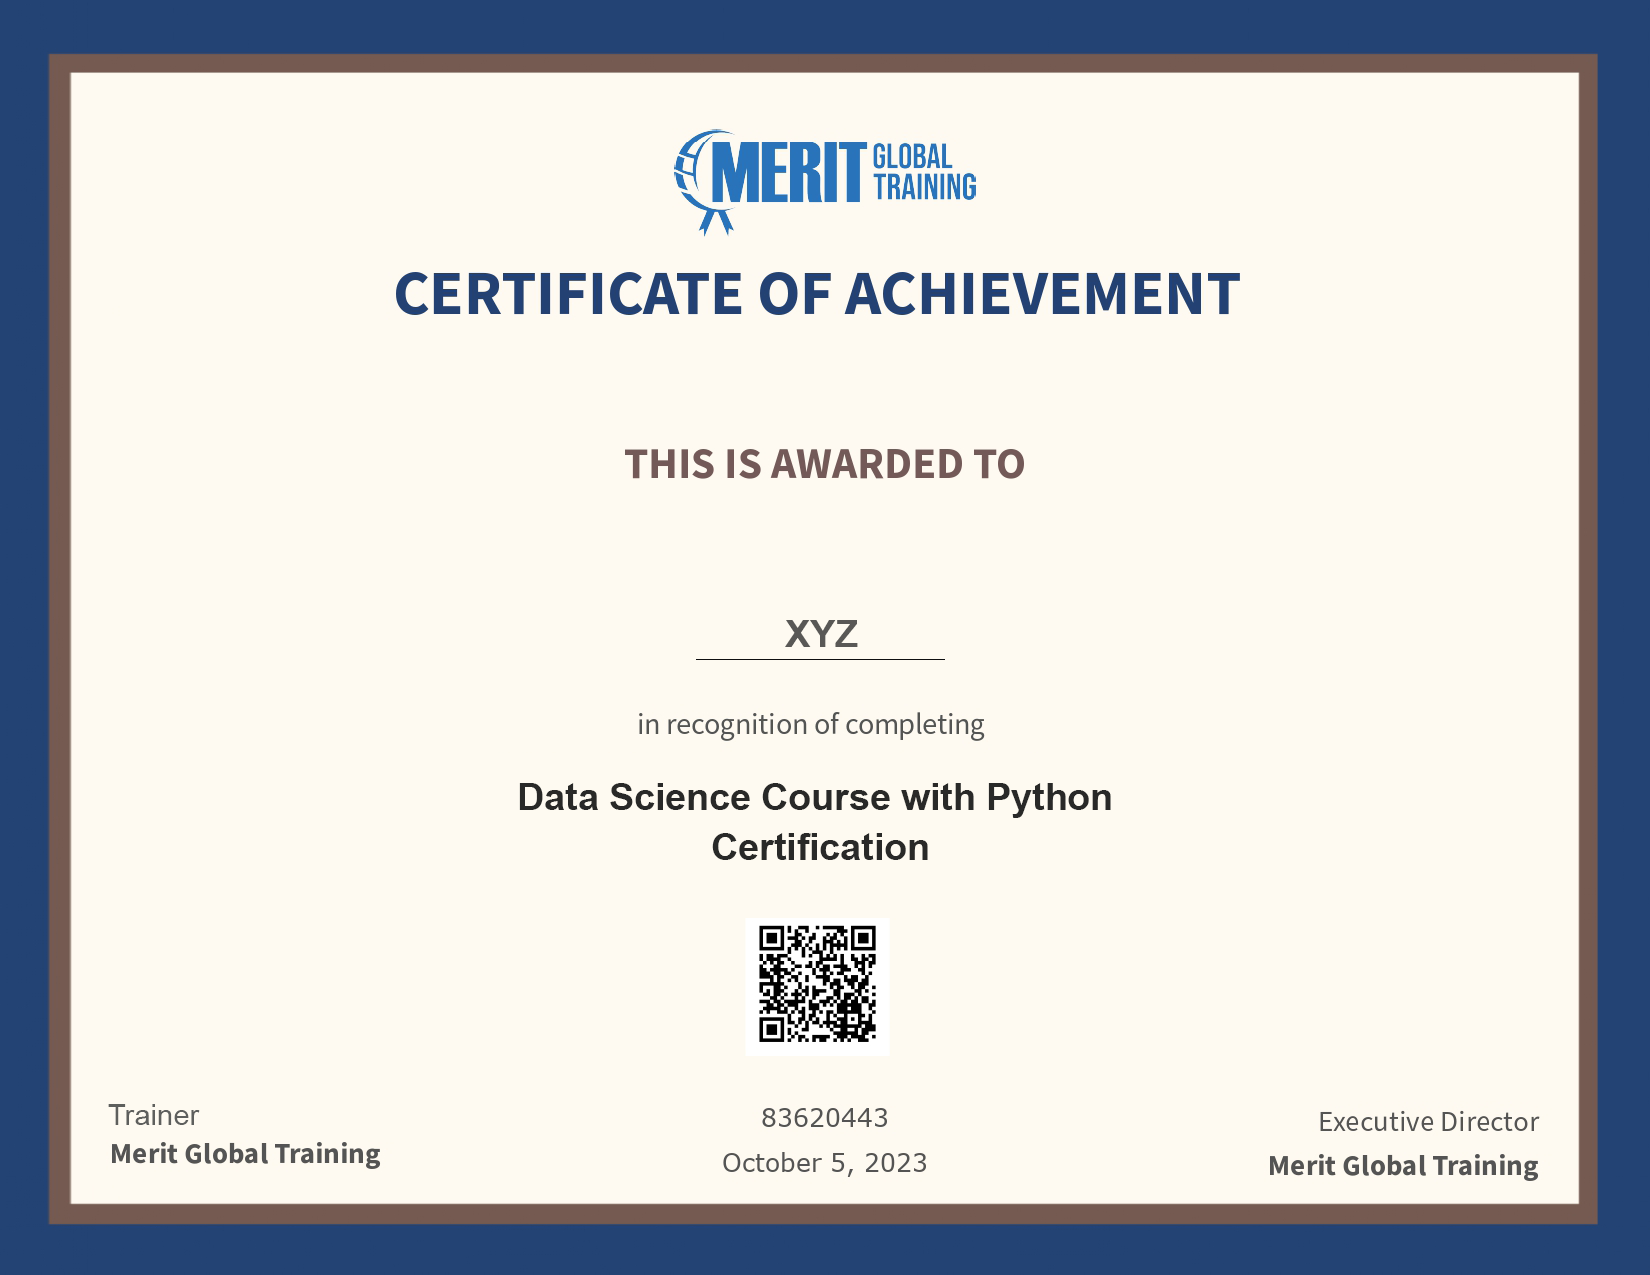
- On successful completion of the course, you will receive a Course Completion Certificate from Merit Global
Certification
- Agile and Scrum Training
- Banking and Finance Training
- Big Data Training
- Business Process Management
- Business Training
- Cloud Computing Courses
- Computer-Aided Design (CAD) Training
- Data Science Training
- Devops Training
- Digital and Innovation Training
- Human Resources
- Insurance Industry Training
- IT Security Training Courses
- Leadership Development
- Oil & Gas Training
- Project Management Training
- Quality Management Training
- Risk Management
- Sales and Marketing Training
- Soft Skills Training
- Software Development
- Supply Chain Management
- Telecom Industry Training
Request a Quote
Feel free to request a quote for corporate in-house programs or our upcoming open events. Write to us at info@meritglobaltraining.com

Request more details

Certificate:

No Open-house Schedules Available At The Moment. Request A Quote For Corporate Group Online Or In-person Training.

Don't Miss Out On Amazing Benefits!
- Why Pay Higher For your Certification Courses when you can get them at much more competitive prices? Take the lowest-price challenge! Submit your Quote.
- Highest Rated For The Quality Training & Services
- 20000+ Certified Every year Through Meritglobal
- Avail Pay Later, EMI Options, Referral Bonus & More

We've successfully received your Message
We revert you shortly
Should your enquiry be urgent, please mail us at info@meritglobaltraining.com or call us +971 50 205 6399 / +91 80885 11977 / +1 863-250-1577

We've successfully received your Message
We revert you shortly
Should your enquiry be urgent, please mail us at info@meritglobaltraining.com or call us +971 50 205 6399 / +91 80885 11977 / +1 863-250-1577
